
Cycling Through The Cycles

Happy New Year!
Some quick housekeeping: I’d like to introduce a new format to the usual weekly newsletter. Substack offers a podcast option as another way creators can bring content to their subscribers. I’d like to occasionally use this and bring guests on to talk about different investment topics. Some would be for premium subscribers, some would be free for all subscribers (~20-30 min conversations). Let me know if this is something you would like to see going forward.
As we enter a new year, many people feel a sense of newness. A clean slate. An opportunity to start fresh and make changes to our everyday lives. It’s a very normal feeling because most things happen in cycles. January 1st is the start of the year’s new cycle.
There are cycles to everything whether its our life cycles, the seasons, the rise & fall of empires or investments.
A rise, peak, fall and trough.
Another word for cycle is pattern.
Patterns are important because once recognized, it allows us to predict what will come next. We can orient ourselves based on patterns and predict what should happen next.
We are more secure and confident in our decision-making once we have the patterns of history to rely on.
What if we could read patterns in the market and use them to guide our investment decisions?
I’ve done a lot of work to compile some of the research that I have been looking at. I want you all to read through this article and understand what’s happening and what we can expect in 2024 and into 2025.
I’ve touched on many of the topics in previous articles but now much of it will be compiled into one.
Think of it as your basic guide to market cycles for 2024.
Below is a chart of Bitcoin. Bitcoin has undergone the same exact 4-year cycle multiple times and looks like it’s on track to do the same thing this cycle. The cycle consists of 3 years of lifechanging generational wealth and up-only price action followed by a dreadful year-long bear market.
If you followed this pattern of buying and holding for 3 years, then selling, rinse & repeat…you’d have done very well.

Will this cycle be exactly like the previous cycles? Not sure, but this data is absolutely something to refer to especially when looking for exit levels.
This chart becomes truly interesting when you see how this pattern actually follows the patterns in the business and macroeconomic cycles.
Nothing operates in a vacuum.
The ISM (Institute for Supply Management) is an important economic indicator that measures the economic climate based on factors such as inventories, sales, employment levels, and inflation. It is a survey that collects data from buyers in companies to provide insights into the current state of the economy. Investors and analysts closely monitor the ISM because it is considered a leading indicator that can provide early signals about the direction of the economy.
When it comes to investing, the ISM can be used to guide portfolio decisions. A higher ISM reading suggests a growing economy and increased business activity, which can be positive for asset prices. Conversely, a lower ISM reading indicates a weaker economic environment, which can impact investment decisions. By tracking the ISM and its trends, investors can gain valuable insights into the prevailing economic climate and adjust their investment strategies accordingly…patterns.

When you look at the ISM overlayed with the forward-looking 3-month lead of the ISM, we’re told that the business cycle could break higher.

Now, it’s worth asking the question: what about the recession that we’ve been hearing about so much? While that is still possible, we are investors. Investors live in the future. We look at forward-looking data to estimate the economy 6-12 months out.
The recession could have already been priced in when markets collapsed to 2022.
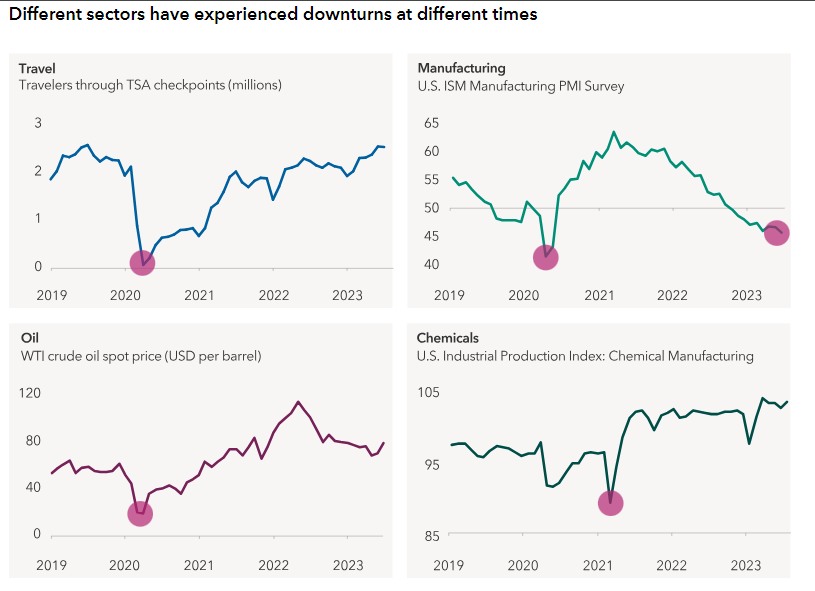
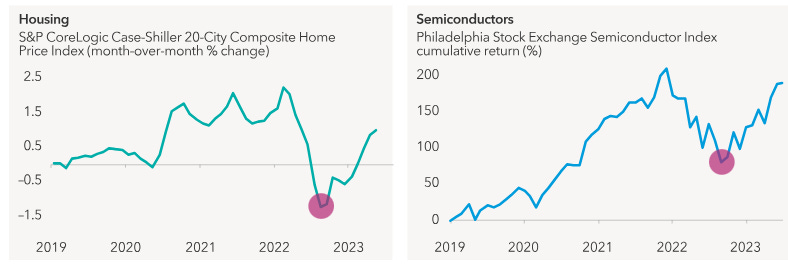
It’s also very possible that we have had a rolling recession. A recession that has hit many different sectors of the economy at different times.
But ISM isn’t the only indicator we should look at. Liquidity, as I’ve written about, is picking up too. When liquidity picks up, it’s game on for risk assets like crypto, tech, etc.
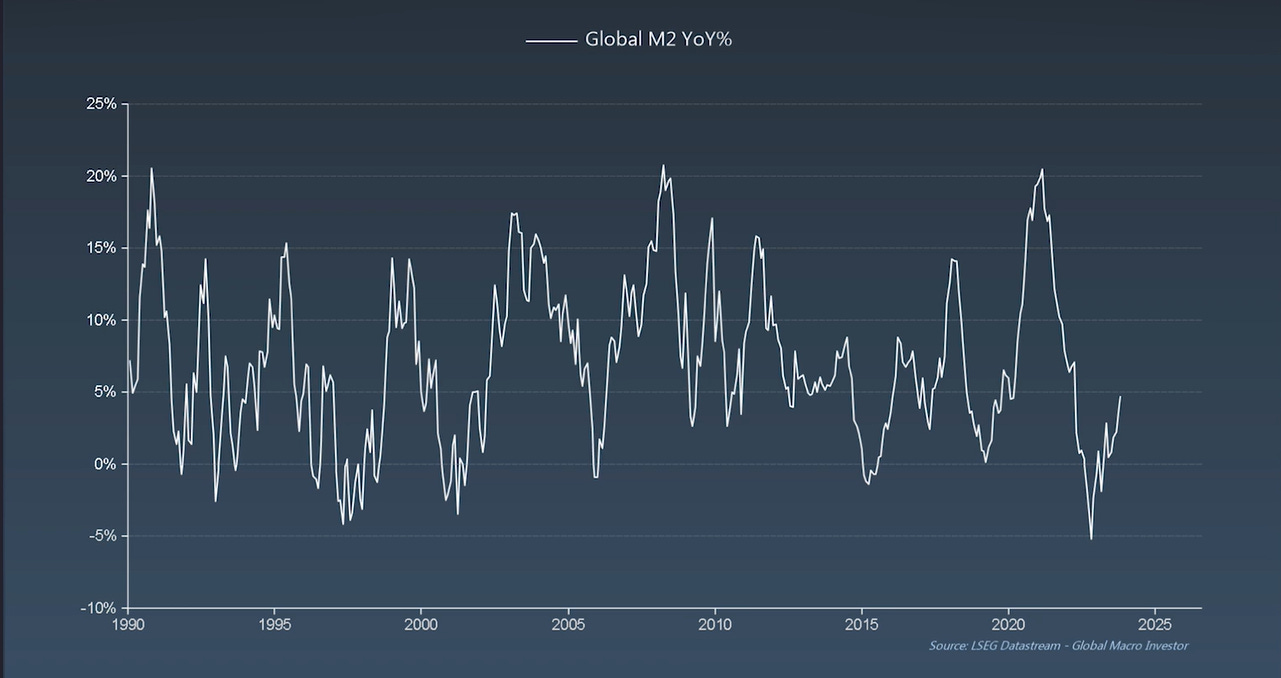

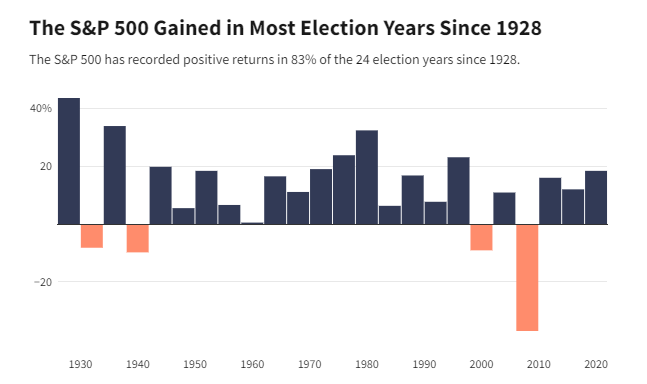
And that should come as no surprise. Election years are usually when liquidity and stimulus ramp up. Politicians want to win elections, so they give out freebies or try to prop up the economy and asset prices.
And inflation is still trending lower, and we can expect that to continue as the year progresses.

If history is any indicator of the future, then we have a lot to be excited about. We’re following simple patterns of the business cycle, the liquidity cycle and the economic cycle.
Now, this doesn’t mean it’s going to be a straight line up…In fact, I’m prepared for a decent-sized sell off.
Keep cool, have dry powder ready to deploy IF this happens.
With the right data, we can find patterns within the market and design our investment decisions. These patterns save us from shooting blindly when choosing where to put our money.
My goal for this year is to show you as many of these patterns as possible and how we can profit off of this knowledge.
In the premium portion of this week’s article, I’m detailing one of my favorite plays for 2024 and beyond - as the money printer keeps printing, as politicians keep handing out stimulus, as inflation comes down.
Let’s make some money…